
Open data is a growing trend in health care. Analyzing data sets across lots and lots of people can help researchers identify medical cures, anticipate epidemics, and solve knotty problems where social and behavioral issues complicate clinical questions and solutions.
Joining the open health data community is the health IT company Practice Fusion, which is sharing with the public aggregated data on some 81 million patients collected through over 100,000 active users every month recording patient data in the company’s cloud-based electronic health records system. Insight, the searchable database, is freely available to people, researchers, policymakers, and anyone who wants to look at top line aggregated data organized in several categories: disease states and conditions, prescribed drugs, BMI, and age cohorts, in this first phase of the launch.
I spent time on the phone and online this week with Chris Hogg, Associate Vice President – Data Science, who leads the Insight project at Practice Fusion. I’ve known Chris for many years, at least since 2008 when I began to follow him on Twitter: he’s been a pioneer in using the internet in health care and so I was keen to dig into Insight with him, first-hand. Practice Fusion acquired Chris’s company, 100Plus, in February 2013.
The f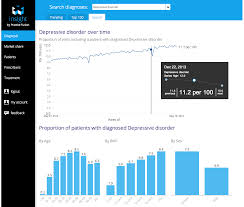 ocus of insight is to make data simple and visual, Hogg explained. We looked at trending diagnoses and the top conditions clinicians saw in the past week, literally. Data gets updated on a weekly basis, with the top findings this week in terms of patients seen presenting with hypertension, high cholesterol, diabetes, depression, arthritis, GI issues, obesity, among others in the top 100.
The user in Insight can explore and search on a specific diagnosis. In our discussion, Chris showed me Insight’s data on depression, and we saw it trending up over the past two years, from 9.5 visits per 100 on June 10, 2012. to 11.7 on June 1, 2014; the upward trend over the 2 years is shown in the diagram. Underneath that macro number, the age cohorts tell an important story — that depression prevalence increases to the highest levels between ages 40 and 59, and also grows in direct proportion to BMI. Many more women are presenting to the doctor than men are, based on these data.
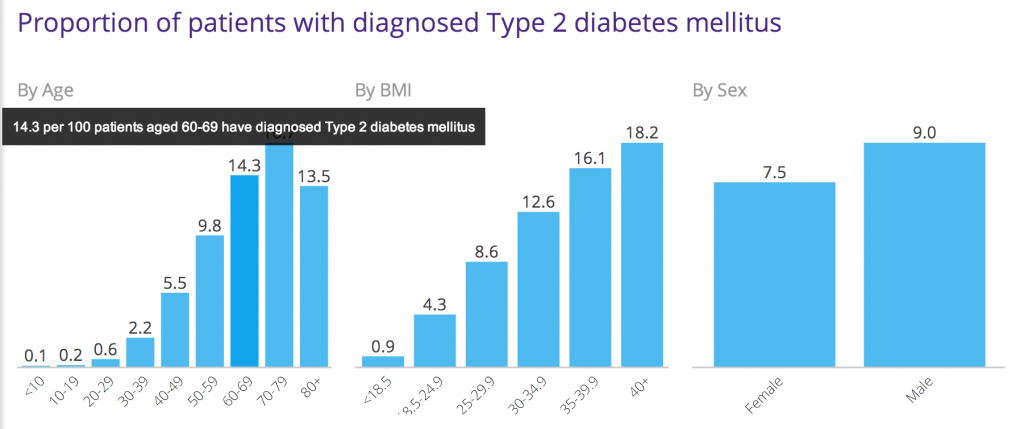 We also looked at Type 2 Diabetes with respect to prescription drug share (that is, which drugs were most prescribed to patients for managing T2 Diabetes). The second chart illustrates the raw truth that as BMI increases, so too does incidence of diabetes, and especially over the age of 35.
Beyond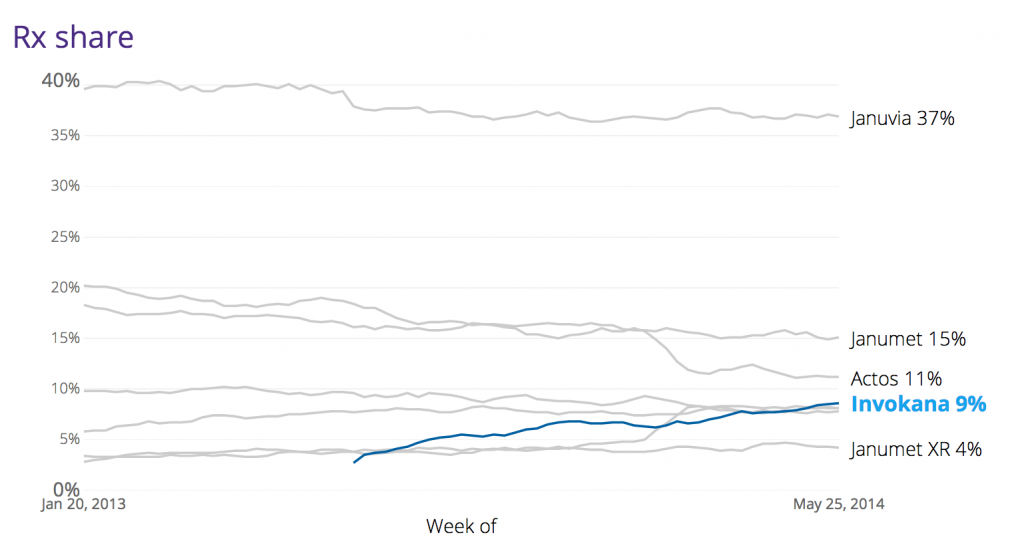 this story, the Insight platform can also look at prescription drug patterns in groups of patients. Chris’s team looked at the pattern of prescribed anti-diabetic drugs in patients with Type 2 Diabetes. The market for anti-diabetic prescription drugs is very competitive; the most popular one is Januvia from Merck. With the introduction of Invokana in March 2013, Januvia took a market share hit, as the third graph illustrates. The data also showed a relationship between physicians prescribing Invokana more among patients who were younger with higher BMI.
The Insight platform can document these kinds of market dynamics in real-time, and can look below this bird’s eye view into patient sub-groups: for example, at market niches of patients by sex, age, geography, co-morbidity, and other patient factors and demographics.
I asked about how representative these data are, knowing that many millions of patient information is recorded in Practice Fusion’s system. The Insight team’s two epidemiologists compared early findings from the Practice Fusion patient data to the CDC’s National Ambulatory Medical Care Survey statistics to see how well the company’s data mapped to the national survey statistics. The data looked very similar, Chris observed, in terms of the top health conditions. The team is working on age and sex adjusting now, along with geographical analyses.
Health Populi’s Hot Points: Practice Fusion knows that there’s no such thing as free lunches or EHRs, with the company’s “free” EHR being supported by advertising and other revenue generating supports. In the case of Insight, there’s the free top line — which in itself is useful for analysts, journalists, patients, and others keen to access health data on a macro level. For those people who want to get more micro, Insight is available for querying specific questions that can be tactically very useful. For example, a pharmaceutical marketer can learn, in near-real-time, how the launch of a new drug is faring with respect to new prescriptions written for patients substituting existing competitive drugs for dealing with, say, Type 2 Diabetes as discussed or high cholesterol or any of the 100 or more conditions captured in the platform.
Another very practical use for public health will be anticipating seasonal flu trends migrating from region to region in the U.S. based on “complaints” of patients presenting to physicians. These visit reasons are recorded in the EHR, and as viruses emerge in one region, Insight can predict their emergence in another and prepare physicians and patients in advance in near real-time.
Chris anticipates that Insight will continue to add functionality and different categories for analyzing aggregated patient data. along with cuts on regional variations. I’m particularly interested to see more social and behavioral “lenses” on the data, such as smoking, food and nutrition intake, alcohol use, vaccination rates, and exercise, to help consumers and providers move the needle on noncommunicable diseases that increase costs and the chronic health care burden in the U.S. health economy. These are the diseases that are most amenable to consumers’ self-care and -intervention. One look at the simple chart on BMI increasing risk for Type 2 Diabetes could help a segment of people who are pre-diabetic start walking a little more and shopping for healthier food.
 Grateful to Gregg Malkary for inviting me to join his podcast
  This conversation with Lynn Hanessian, chief strategist at Edelman, rings truer in today's context than on the day we recorded it. We're