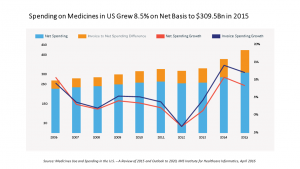
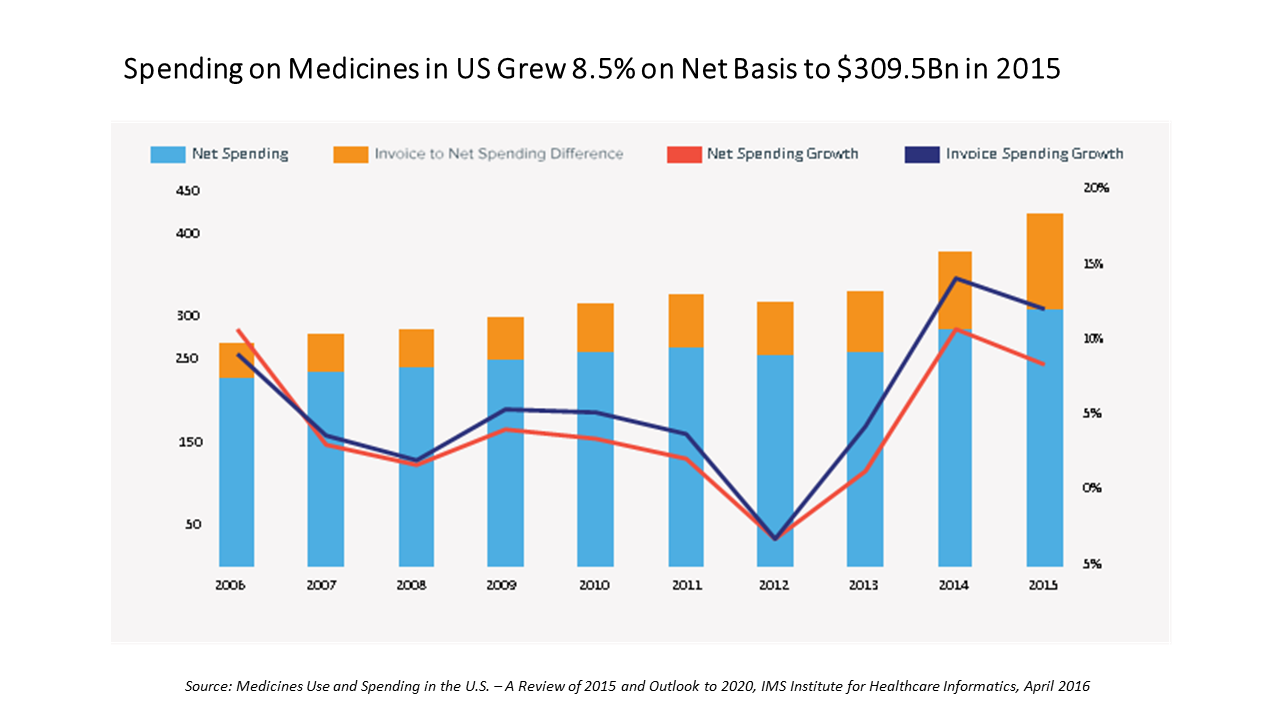
In the U.S., spending on prescription medicines reached $425 bn in 2015, a 12% increase over 2014.
For context, that Rx spending comprised about 14% of the American healthcare spend (based on roughly $3 trillion reported in the National Health Expenditure Accounts in 2014).
We can expect double-digit prescription drug cost growth over the next five years, according to forecasts in Medicines Use and Spending in the U.S. – A Review of 2015 and Outlook to 2020 from IMS Institute of Healthcare Informatics.
The biggest cost growth driver is specialty medicines, which accounted for $151 bn of the total Rx spend in 2015, an increase of 21.5% over 2014 IMS Institute points out. “This remains one of the most dynamic segments of the total market,” the report notes — meaning for us to expect specialty drugs to play a growing role in clinical use/treatment and in the economics of healthcare. The top-used specialty treatments were for cancer/oncology, Hepatitis C, and multiple sclerosis.
Volumes for prescription grew at only 1% over 2014. But underneath that, growth areas were in antidepressants and 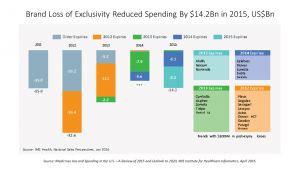 diabetes meds which increased in volume by 10% each.
Patient cost exposure (copayments, coinsurance, and out-of-pockets) for branded prescriptions in commercial plans grew by over 25% since 2010, hitting $44 per Rx in 2015. Generic exposure was flat at $8 since 2010. The second chart illustrates the growing number of brand name Rx’s that are going off-patent to generic class: in 2015, Abilify, Nexium, Namenda, and Copaxone went generic, among others, representing a $14 bn reduction in brand spending last year.
The topline spending number of $425 bn is the total spending for prescription drugs based on “invoicing,” the all-in price x volumes prescribed. However, IMS Institute recognizes that for patients, brands can be “bought-down” through savings programs like coupons and vouchers, and patient assistance programs. IMS Institute estimates that discounts, rebates and other price concessions reduced invoice spending by about 27%. Nonetheless, patients who have high-deductible health plans (a growing proportion of the insured in America) bear high cost exposure compared with patients with other types of insurance. For branded prescription drugs, IMS Institute calculates that about 40% of pharmacy deductible claims are exposed to costs over $50.
Some other observations worth noting include:
Growing prescription drug writing by nurse practitioners and physician assistants, more than doubling over the past five years: 17% of all retail prescriptions were written by NPs and PAs in 2015, up from 9% in 2010 (from 327 mm in 2010 to 676 in 2015). Many states are expanding prescribing authority to NPs especially in primary care shortage areas.
The top therapeutic classes for prescriptions in 2015 were antihypertensives, mental health, pain, antibacterials, lipid regulators, antidiabetes, nervous system disorders, respiratory, and anti-ulcerants.
The top medicines prescription by non-discounted spending were Harvoni, Humira, Enbrel, Crestor, Lantus SoloStar, Remicade, Advair Diskus, Abilify, Copaxone, and Januvia. These meds covered Hep C, rheumatoid arthritis/inflammation, high cholesterol/statins, diabetes, respiratory, mental health, and multiple sclerosis.
The most popular dispensing locations are in retail settings, including chain pharmacy stores (just under one-third of total Rx spending), and mail order (about 23%): these two channels comprise one-half of all Rx spending. Non-retail (clinics, hospitals, long-term care, etc.) accounted for $119 bn of the total $425 bn spent, just under one-fourth.
Prospects for innovative meds are bright, IMS Institute concludes, with 2,320 novel products and nearly 50 New Active Substances expected to be launched in each year to 2020.
Health Populi’s Hot Points: In the next five years, there will be $282 bn in growth from branded medicines, and $91 billion of that will come from new medicine launches. Most of these are expected to address oncology/cancer, IMS Institute projects.
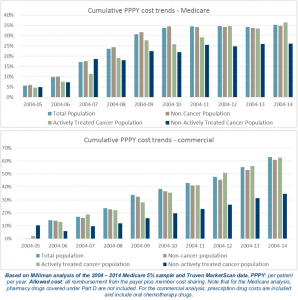 A study published this month by Milliman on the cost drivers of cancer care found that the costs for treating cancer in the U.S. have not increased any faster than other (non-cancer) healthcare spending in Medicare and commercially insured patients. The cost of chemotherapy drugs increased at a significantly higher rate than other cost components of treating cancer patients, driven by specialty drug costs (biologics) — but Milliman calculates that at the same time, the growth rate for other cancer care costs have slowed, such as inpatient services and cancer surgeries. The site of cancer care has also shifted from doctors’ offices to hospital outpatient departments, driving cancer costs up. This study was commissioned by the Community Oncology Alliance (COA), the advocacy organization for oncologists, hematologists, pharmacists, mid-level providers, oncology nurses, patients, and survivors working in the community.
What about the cancer patient her/himself who’s not only combating the condition but faced with the challenging payment regime of high-deductibles, co-payments and coinsurance for specialty drugs — which Milliman/COA recognize is the fastest-growing component of the cancer bill?
IMS Institute heralds the oncology innovations expected in the next five years? Patients and their loved ones will surely welcome these innovations? But will people be able to afford the new-new meds? Patients will need to have access to another kind of innovation, in health economic terms — realistic “buy-downs” and patient access programs that speak to financial wellness as much as clinical.


 Thank you FeedSpot for