Patients in the U.S. assume the role of payor when they are enrolled in high-deductible health plans. People are also the payor when dealing with paying greater co-payments for prescription drugs, especially as new therapeutic innovations come out of pipelines into commercial markets bearing six-digit prices for oncology and other categories.
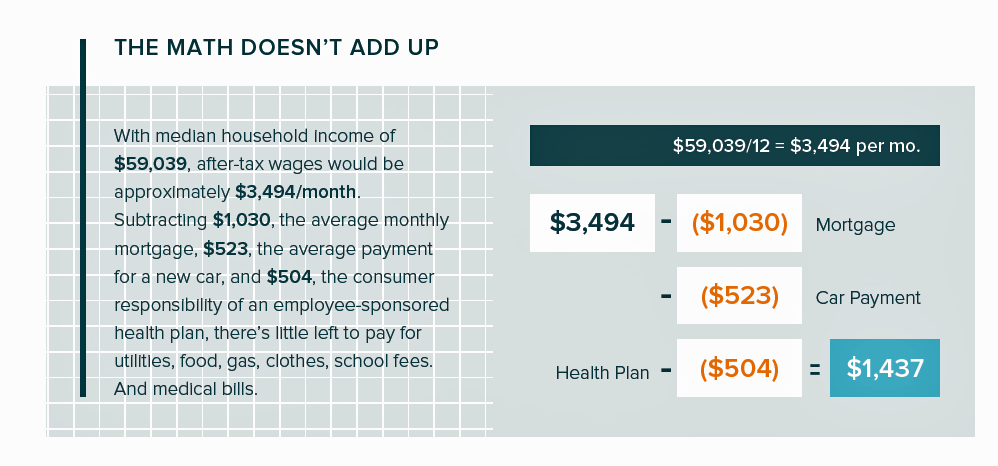
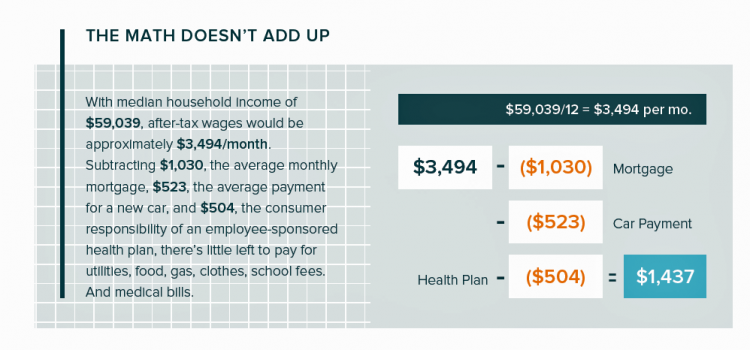
For mainstream Americans, “the math doesn’t add up” for paying medical bills out of median household budgets, based on the calculations in the 2019 VisitPay Report. Given a $60K median U.S. income and average monthly mortgage and auto payments, there’s not much consumer margin to cover food, utilities, petrol, clothing….or medical bills, VisitPay reckoned.
VisitPay conducted a poll among 1,734 U.S. adults 18 and over assessing peoples’ financial behaviors in the context of health care.
“For the first time, the finance team finds itself on the front line of consumer engagement,” David Kirshner, the former FO of the University of Rochester Medical Center asserts in the report.
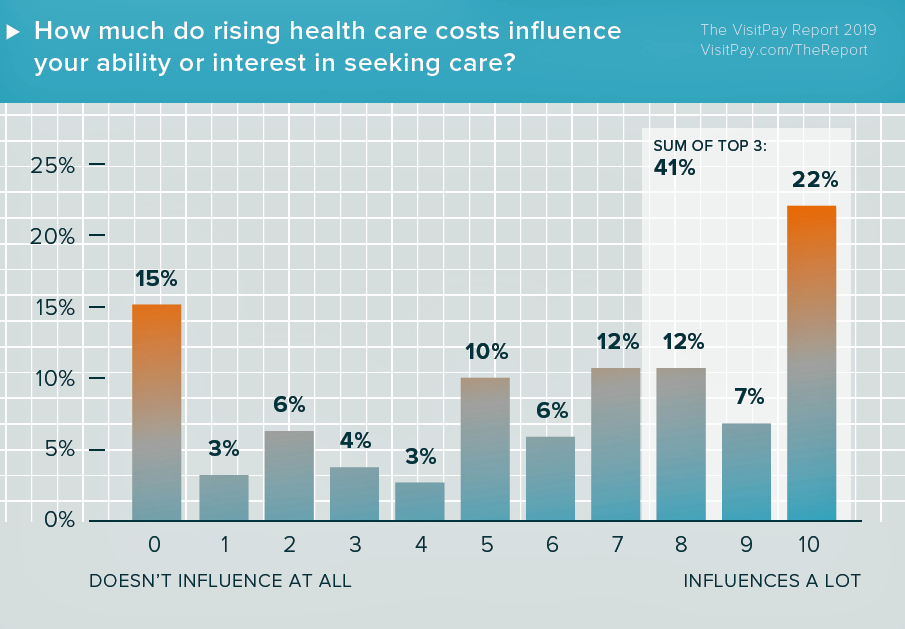
Patients-as-health-consumers are highly influenced by health care costs when assessing their ability or interest in seeking health care, the second chart from the VisitPay survey report illustrates. When evaluating health care options, consumers said the most important factor weighting into their choice was insurance, cited by 84% of patients; another 75% of people said the health system’s reputation was the most important factor, following by 69% citing location, and 66% each noting cost and the reputation of the doctor.
Cost influenced two-thirds of patients in terms of their satisfaction with a physician or a health system.
Although most consumers say that medical costs impact both their selection of a provider or service, as well as their ultimately satisfaction with that care, 67% of consumers told VisitPay that they did not obtain cost estimates for medical services prior to receiving care in the past year.
Only 30% of people said their health care system offered information about costs and/or payment options before their treatment or procedure.
Patients-as-health consumers would like to hear about payment plans, in particular via the statement, through the doctor during an appointment, in a brochure detailing comprehensive information about both the treatment and bill payment options, or speaking with a person from the health system. One-fourth of consumers would prefer to research payment options online.
 Online is also the top-chosen channel for paying a medical bill: 34% of patients said they’d prefer to pay a bill online through a health system, and 33% online through their bank account. Another one-third said they’d like to pay by mail.
This begged the question of “who” chose which payment channel. A plurality of younger patients between 18 and 40 years of age would prefer the online methods for payment, while people 65 years of age and older would prefer paying by mail. Interestingly, people in mid-age between 41 and 65 were roughly equally split in thirds paying by each offer — online through bank or health system, or by mail. Few people want to pay in person or by phone.
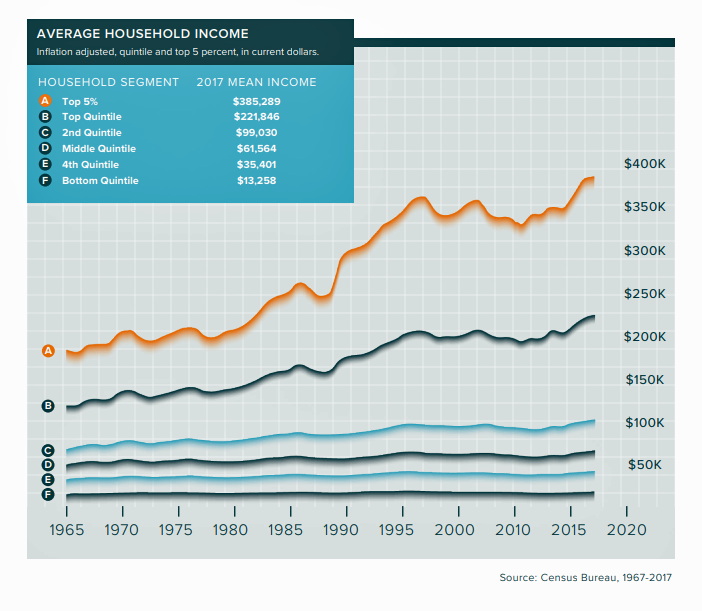
Health Populi’s Hot Points: VisitPay included this third line chart in the report, more closely looking at household income cohorts. In quintiles, 2017 median income ranged from the bottom fifth of homes with $13K, fourth group $35K, middle quintile $61K (close to the median overall), second group at $99K, and top at $221K.
See the adjusted growth across the bottom four quintiles below the orange line to see the story of income stagnation in America below the top-earning householders.
In the latest OECD report Society at a Glance 2019, published last week, the U.S. is compared with peer nations on a broad range of social indicators: financial, health, social, behavioral, and digital. (This year’s survey also provides a deep dive into LGBT people around the world, a topic for another Health Populi – but well worth your reading on people’s social cohesion, equity, and health).
Compare the concentration of wealth (as opposed to income) in the U.S. versus other countries in the Organization of Economic Cooperation and Development, graphed in the fourth bar chart. You can spot the OECD average of the 27 nations in red, between Japan and France.
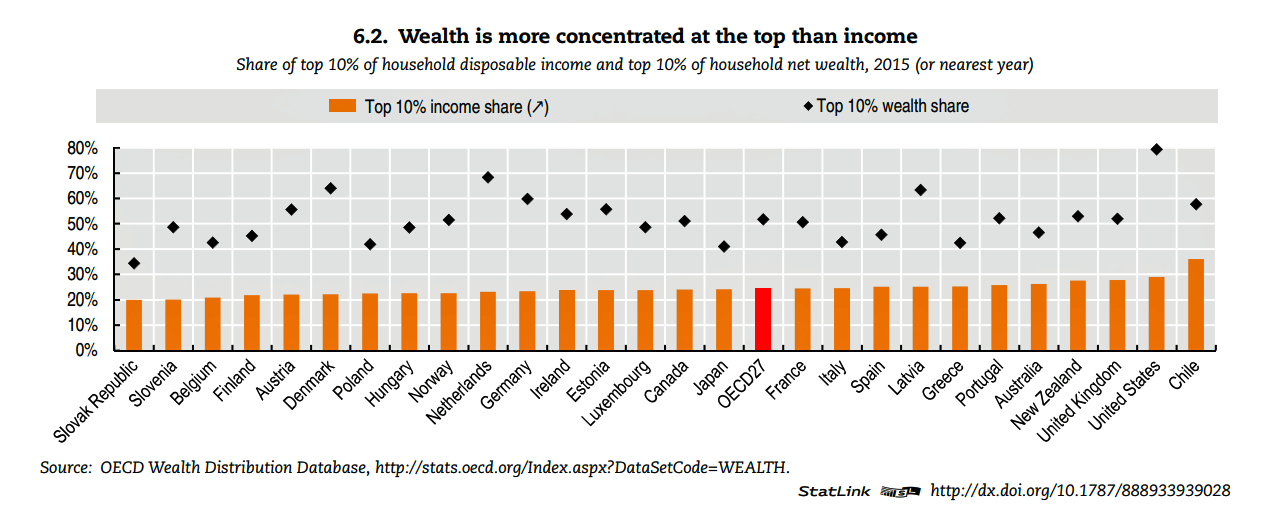 The U.S. lies to the far right of the OECD average, with the top 10% wealth share above every other country in the organization.
In the U.S. summary of this study asking, How does the United States compare? the OECD notes in a section of “risks that matter, “Americans today feel financially insecure. 48% of Americans list ‘struggling to meet daily expenses despite working’ as a top-three risk in the next couple of years. When looking beyond at the next decade, 71% of Americans identify financial security in old age as one of their top-three risks.”
As health reform continues to loom large in the eyes of Americans and their legislators, the financial security of patients — as both taxpayers and voters — must become the context for considering legislative options. Most Americans want government to do more to help them, the OECD survey found. Ironically, median disposable household income in the U.S. is higher than in most OECD nations. However, income inequality is high with only Turkey, Mexico, and Chile in worse positions.
With high health spending and lower life expectancy dollar for dollar, financial and health in-security will surely be voters’ priorities in 2020. As they will also be top-of-mind for U.S. hospital and healthcare Chief Financial Officers’ minds.



 Thanks to Feedspot for naming this blog, Health Populi, as a