Millions of Americans believe they have been treated negatively by a physician due to their weight, insurance status, physical appearance and/or state of mental health, according to a YouGov poll published August 6, 2024. 
To gauge U.S. health citizens’ perceptions of fair and unfair treatment in the health care system, YouGov conducted this research among 1,200 U.S. adults 18 and over online in late June 2024.
The first bar chart arrays various identity characteristics describing patients: we see that weight is by far the top characteristic putting the person at-risk for being treated negatively by a doctor.
Insurance type (or lacking insurance coverage), one’s physical appearance, mental health, age, gender, lifestyle, medical opinions and history, and substance use can also figure into how patients feel doctors treat them. 
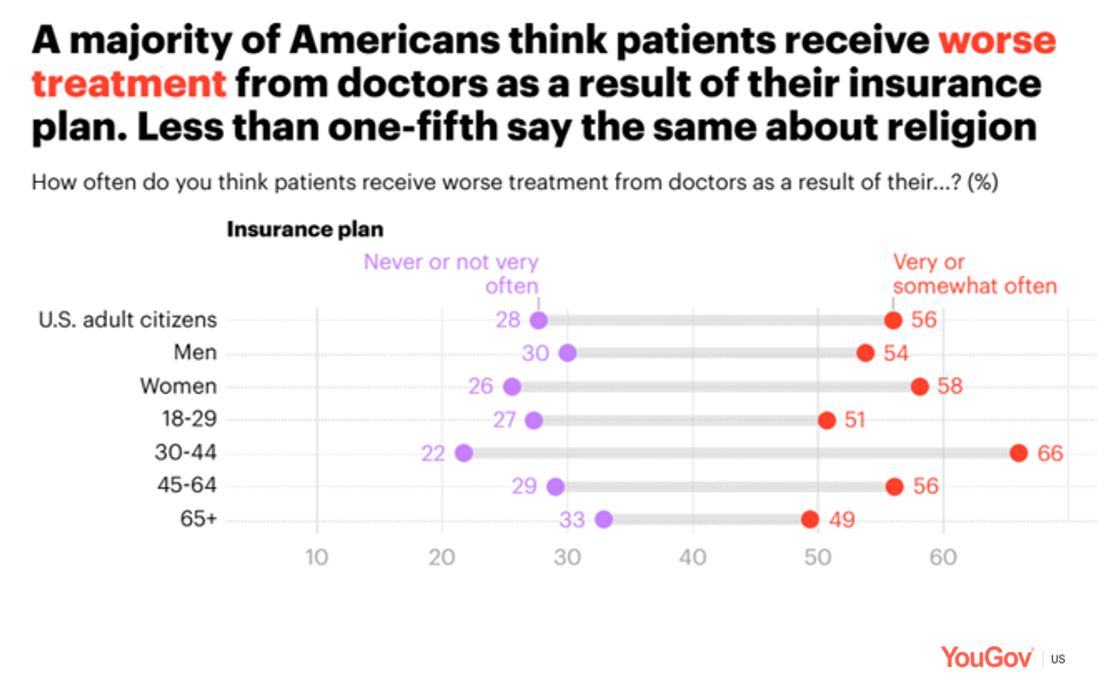
Breaking out gender and age demographics for the insurance status characteristic, slightly more women than men feel negatively treated based on their insurance situation, and two-thirds of patients between 30-44 years of age, as well.
Even 1 in 2 seniors, 65 and over, perceive they have received worse treatment as a result of their insurance plan — in this case, we hypothesize Medicare as the plan for folks 65+.
In this go-go era bullish on GLP-1 drugs for diabetes and overweight, not that most women (51%) believe patients receive worse treatment from doctors based on weight. This statistic also peaks in the 30-44 age group at 56%, compared with 43% of the general 18+ population.
The breakout statistic on Race has an interesting result based on gender split: many more women than men (43% versus 31%) believe that patients receive worse treatment from doctors based on race (with overall population of 37% feeling this way). Religion receives the lowest incidence of patients feeling doctors treating them worse based on their faith. 
What’s most important, then, for choosing a doctor among the patients in this study? Insurance acceptance, appointment availability, and experience of the physician rank in the top 3 for 92-94% of patients.
A doctor’s age, their gender, and religion rank at the bottom of patients’ concerns when choosing a doctor.
Empathy ranks relatively high. but several points below insurance status and appointment availability, with bedside manner and patient ratings figuring into patients’-consumers’ selection of physicians.

Health Populi’s Hot Points: This last chart illustrates that patients differentiate between doctors and nurses on one hand, and the macro healthcare system on the other — the point being that most patient-consumers in the U.S. think more favorably about nurses (87% favorable) and doctors (78% favorable) versus the health care system, with only 40% of all consumers having favorable opinions.
Favorability for nurses ranks highly consistent with the annual Gallup Poll on honesty and ethics in professions, a study where year after year nurses rank highest among all job types in the U.S.
Nurses garner more favorability among U.S. consumers across gender and age compared with physicians.
Women’s perception of favorability among nurses is quite close to men’s (83% vs. 85%) but for physicians, there is a much larger delta — 74% of women with favorable opinions of doctors compared with 81% of men.
So we see a gender-gap, a statistical thought-point to add into our current thinking about women in the context of U.S. healthcare which I have had a focus on since the Dobbs decision emerged. With 2024 being a major election year, the role of women (in and beyond health care) will play large into the polls at both national and state levels, up and down ballots.