People in the U. S. are spending over 20.6% of their income on health care, according to data published by the U.S. Department of Commerce on March 2, 2015. This is up from 15% of personal income in 1990.
Note the slope of this curve, moving up the X-Y axes from southwest to northwest.
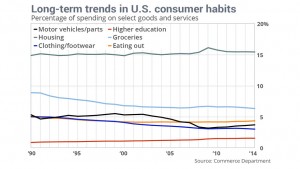 Now note the slope of the curves in the second chart, which illustrates consumer spending on other household goods and services: cars, housing, clothing, education, groceries, and eating outside of the home. Spending on these home budget line items remained relatively flat over the 25 year period 1990-2015, with education spending ticking up from 0.9% of income to 1.6%, MarketWatch calculated.
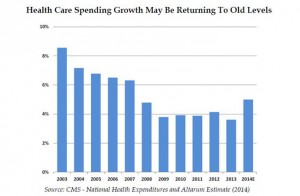 Health Populi’s Hot Points: The growth rate of macro-health spending had moderated until last year, with growth increasing by 5% in 2014 according to Altarum Institute estimates. The first bar chart illustrates that 2014 growth rate for health care spending exceeds that of 2008, the year the Great Recession began.
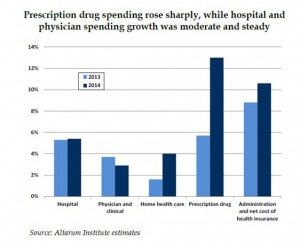
The second bar chart illustrates the areas where health care spending is growing fastest: prescription drug costs, which grew at 13% in 2014, and the costs of health insurance, growing over 10% in the year.
Prescription drug costs are in our health economics’ radar because, notwithstanding the mass adoption of generic drugs, the big Rx cost driver is specialty drugs. Beyond the sticker-shock of Sovaldi and expensive Hep-C treatments, we expect two drug class categories to reach roughly six-figure price tags in 2015: PCSK-9 inhibitors to treat cholesterol, and PD-1/PDL-1 inhibitors for cancer. CVS Health estimates that the former could cost the U.S. health system at least $100 billion a year.
As a result of these and other health care cost trends, with health plan sponsors continuing to shift financial risk to consumers, people can expect to spend at least 20% of their income, and not less.


 Thank you FeedSpot for