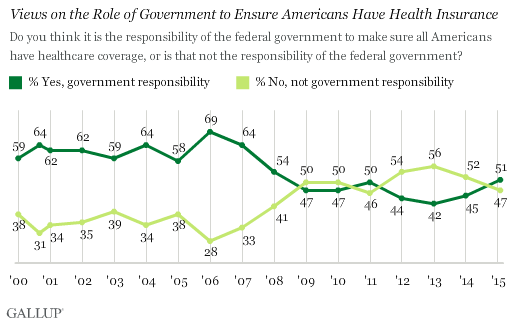
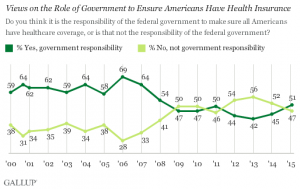
For the first time since 2008, a majority of Americans say government is responsible for ensuring that people have health insurance. The first chart shows the crossing lines between those who see government-assured health insurance in the rising dark green line in 2015, and people who see it as a private sector responsibility.
The demographics and sentiments underneath the 51% are important to parse out: people who approve of the Affordable Care Act are over 3x more likely to believe in government sponsoring health insurance versus those who disapprove, 80% compared with 26%.
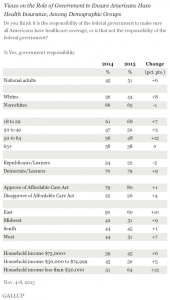 The demographic differences are also striking, detailed in the second chart:
- Younger people under 50 tend to favor government-sponsored health insurance more than people over 50: 68% of Americans 18-29 and 50% of those 30-49 favor the government option, compared with 48% of those 50-64 and 38% of people age 65 and over. Note that across all age cohorts, the percent of people who favor government sponsored health insurance grew over the past year except for people 65+, where the percentage stayed flat at 38% favorite the government scenario.
- More Nonwhites, 65%, favor government sponsored health insurance than Whites, 44%.
- More Democrats favor government-sponsored health insurance than Republicans — 79% vs. 22%.
- More people with lower incomes favor the government option than the private sector option: for people with household income under $30,000, 64%, compared with 50% of people with incomes $30K-$74,999, and 45% of those with household income $75K+.
- Regionally, people who live in the East are more likely to prefer government-sponsored health insurance at 60%; people living in the South are less likely to prefer the government option, where 45% of consumers go for public sector provision.
The survey was conducted by telephone between November 4-8, 2015, among 1,021 U.S. adults.
 Health Populi’s Hot Points: The great irony of consumer-directed health care is that, instead of empowering patients to behave like consumers, people feel caught out — dis-empowered victims of a health care payment regime with little price or quality transparency, support for decision making, and continued fragmentation of health care services and personal workflows. These negatives, in addition to having to pay more first-dollar coverage and manage more of the financial aspects of care–when most U.S. adults don’t sufficiently save in 401(k) plans when made available or balance their checkbooks.
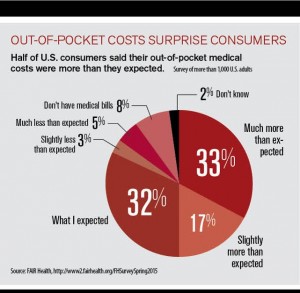
The pie chart from FairHealth’s spring 2015 consumer survey illustrates that fully one-half of American patients were surprised by the amount of their out-of-pocket costs in being more than they expected to pay. Only one-third felt they knew what their costs would be (the “what I expected” slice).
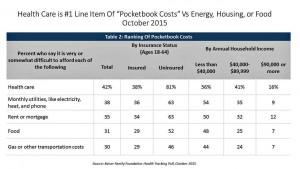 Another important data point to consider beneath this survey came out of Kaiser Family Foundation’s October 2015 Health Tracking Poll on Americans’ “pocketbook” issues, shown in the fourth chart. Above paying for utilities, housing, food and gas, health care costs rank #1 on Americans’ minds in the current economic environment. People continue to live in the post-recession with frugal mindsets, and health care cost sticker-shock, illustrated by FairHealth’s pie chart, make this clear. Even people living with households earning over $90,000 a year say health care costs rank top of pocketbook issues above all other spending categories.
This is the second major data finding indicating that Americans’ appetite for government intervention in health care is growing: couple this with the November 5 2015 HealthDay/Harris Poll identifying U.S. health citizens’ call for more regulation of prescription drug prices (discussed here in Health Populi) and you have the makings of a growing sentiment for the government’s role in American health care. You can be sure it’s peoples’ growing out-of-pocket costs in the so-called consumer-directed era that are contributing to this reversal of feeling seen in the top chart from Gallup’s poll.


 Thank you, Trey Rawles of @Optum, for including me on
  I was invited to be a Judge for the upcoming
  For the past 15 years,